Project
←Back to projects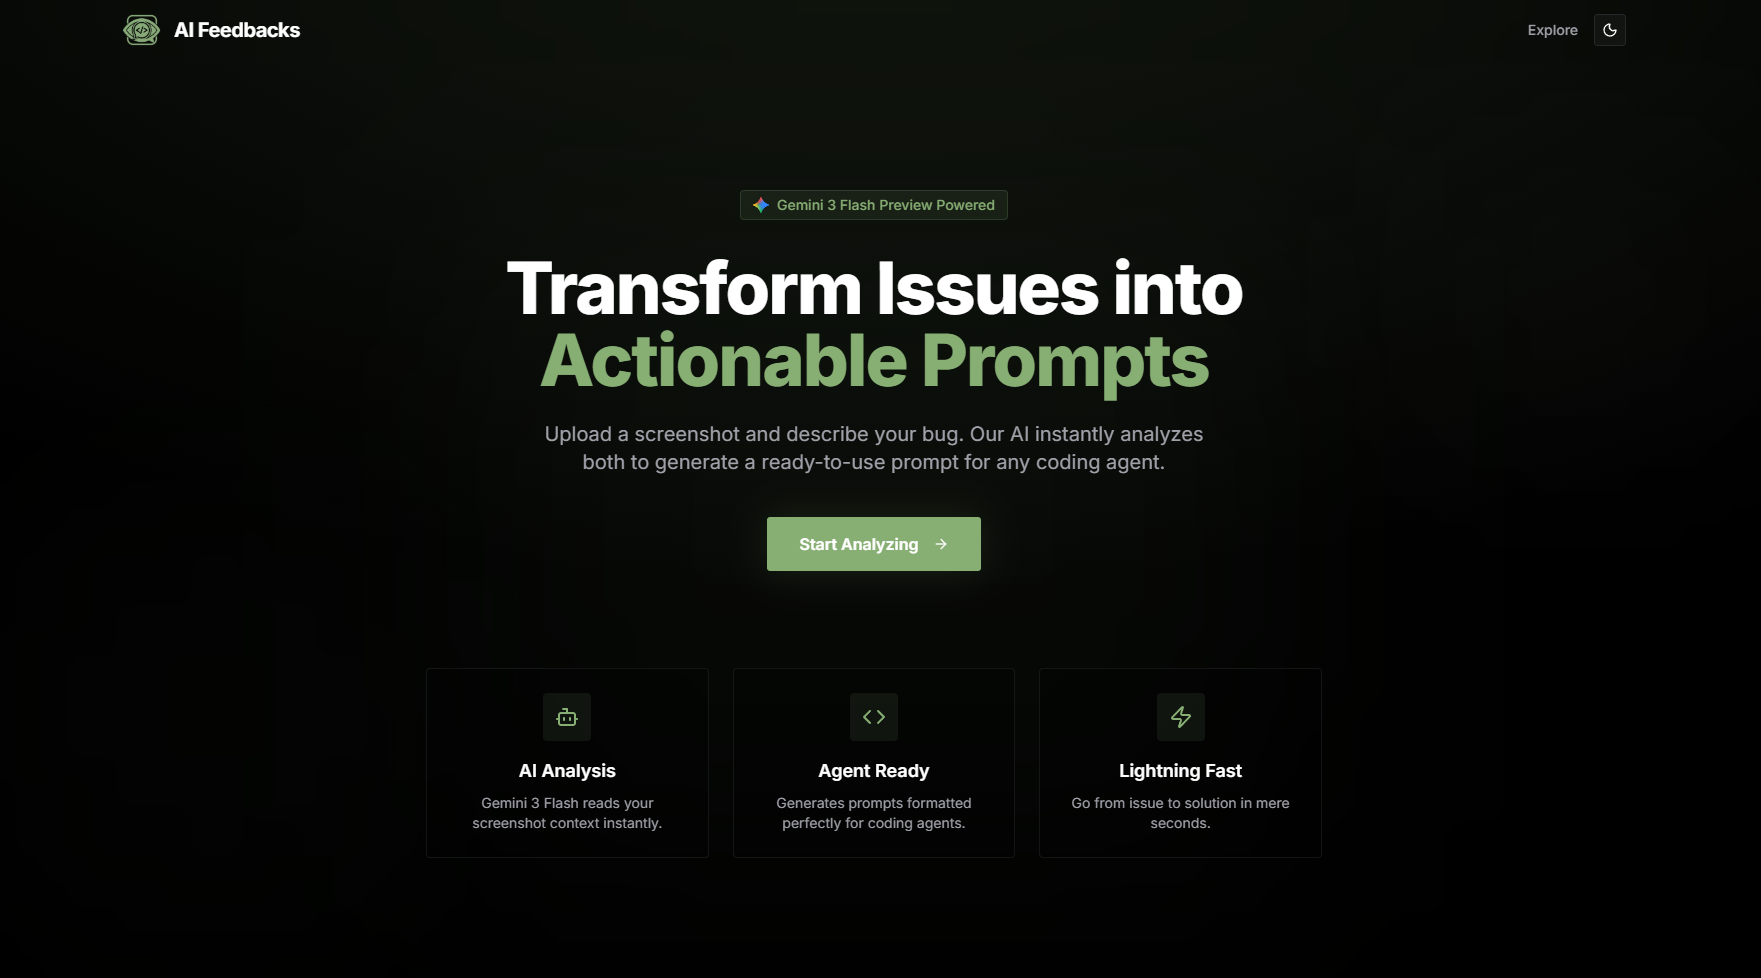
february 26, 2026
AI Feedbacks
AI Feedbacks
A multimodal bug capture and prompt synthesis engine that closes the gap between issue discovery and resolution. The Chrome extension grabs the full failure context — screenshot, DOM state, console errors, network failures — at the moment it exists. The Next.js backend sends it to Google Gemini and returns a structured, fix-ready prompt suitable for Cursor, Windsurf, or any agentic coding tool.
Overview
Standard bug reporting is a lossy compression problem. By the time a developer files a ticket, the screenshot has been cropped to the wrong region, the console errors are gone, and the network tab has been refreshed. When that thin description reaches an AI coding agent, the result is hallucinations or a five-message interrogation before the agent understands what actually broke.
AI Feedbacks solves this by treating bug capture as an instrumentation problem, not a documentation problem. Context is captured automatically at the moment of failure, not reconstructed from memory afterward.
Architecture
The system is a two-component pipeline: a Chrome Manifest V3 extension that runs in the browser and a Next.js 15 backend that owns the AI analysis and persistence layer.
Chrome Extension (Manifest V3)
The extension has three components with distinct responsibilities:
content.js runs as an injected content script on every tab. It intercepts console.error and console.warn calls by wrapping the native console methods, and monkey-patches XMLHttpRequest and fetch to capture failed network requests (4xx/5xx status codes) from the last 60 seconds. This state is held in-page memory, ready for collection on demand.
popup.html + crop tool provides the user interface when the extension icon is clicked. It renders a crop selector overlay on the active tab, allowing the reporter to highlight the exact region of the failure rather than capturing the full viewport. The cropped area is rendered to a canvas and serialized as a base64 image buffer.
background.js is the Manifest V3 service worker. It coordinates between the popup and content script via chrome.runtime.sendMessage, collects the screenshot buffer and captured console/network logs, and POSTs the assembled payload to the dashboard API.
Next.js 15 Backend
The backend is a Next.js 15 application with two API routes:
/api/analyze receives the bug payload — screenshot buffer, console errors, network failures, and a one-line description — and calls Gemini via the AI SDK's streamText function. The screenshot is passed as an image part alongside the text context. Gemini processes the visual and textual data together and returns a structured prompt identifying the broken component, the relevant network failures, and a fix instruction. The response streams back to the client incrementally.
/api/feedbacks handles CRUD for persisted reports. The dashboard indexes all submitted feedback and exposes a natural language semantic search interface — queries like "login button error from last week" or "the white flash on mobile" resolve without exact keyword matching.
Key Features
- Multimodal context capture — screenshot, DOM state,
console.error/console.warnoutput, and failed network requests (4xx/5xx) from the last 60 seconds, all captured in a single extension action - Crop selector — reporters highlight the specific failure region rather than submitting a full-page screenshot, reducing noise in the Gemini prompt
- Structured Gemini output — the analyze route is prompted to return a structured fix instruction, not a freeform description; output is immediately pasteable into an agentic tool
- Streaming response —
streamTextstreams the Gemini response token-by-token so the dashboard populates progressively rather than waiting for the full completion - Semantic search — past reports are searchable by natural language query, not tags or exact keywords
- Vercel-native deployment — the Next.js app deploys with
vercel --prod;GEMINI_API_KEYis the only required environment variable
Implementation Details
Why a Chrome Extension Instead of a Bookmarklet or SDK
The Manifest V3 service worker architecture was chosen over a JavaScript bookmarklet or an embeddable SDK for two reasons. First, a content script has persistent access to the console and network interceptors from page load — a bookmarklet injected on demand can only capture errors that occur after injection. Second, the extension's chrome.scripting API allows screenshot capture of the active tab, which is not available to page-context JavaScript.
The trade-off is that the extension requires a one-time install from chrome://extensions in developer mode. For a developer tooling use case, this is appropriate — the audience is engineers who already have that workflow.
Gemini Model Selection
The backend defaults to gemini-3-flash-preview, which was selected over the Pro tier for latency reasons. A bug report submission should feel interactive — a 2-3 second response is acceptable, a 10+ second wait breaks the capture flow. The Flash model processes the multimodal payload (image + text context) fast enough to stream the first tokens within a second of submission on typical payloads.
Network Capture Window
The 60-second rolling window for network error capture is a deliberate boundary. Capturing the entire session's network history produces too much noise for Gemini to reason about precisely. A 60-second window captures the requests immediately preceding the failure — the likely causal chain — without including irrelevant earlier activity.
Semantic Search Implementation
The dashboard's semantic search is backed by the feedback stored in the Next.js API layer. Queries are processed against stored report content using embedding-based similarity rather than full-text search, enabling natural language retrieval without requiring reporters to apply consistent tags or categories.
Tech Stack Rationale
| Component | Technology | Rationale |
|---|---|---|
| Dashboard | Next.js 15 | App Router enables co-located API routes and streaming RSC; avoids a separate API server |
| Styling | Tailwind CSS v4 | CSS-first configuration; no PostCSS config overhead |
| AI | Google Gemini | Native multimodal support — image and text in the same API call without preprocessing |
| Extension | Chrome MV3 | Service worker architecture required for tab screenshot access and persistent console interception |
| Forms | TanStack Form | Type-safe form state with minimal bundle overhead |
| Animation | Framer Motion | Declarative animation primitives for the crop selector overlay and dashboard transitions |